By Evan Wyloge
Jan 23, 2024
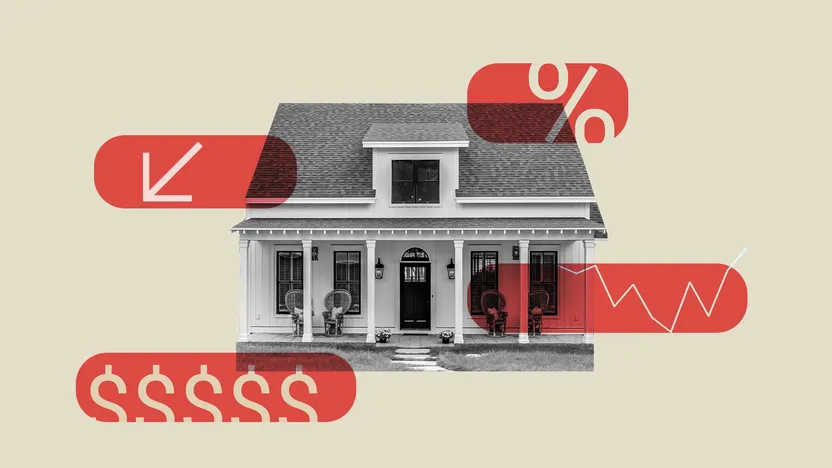
Anyone who shopped for a house last year grappled not only with high mortgage rates, but also another equally vexing problem: very few homes for sale.
These two problems were connected, of course.
High rates created a “lock-in” effect discouraging homeowners from putting their homes on the market and having to give up their current low mortgage rates. Many homeowners opted to stay put, leaving homebuyers with slim pickings.
But this scenario might soon change as more homes come on the market. A new Realtor.com® report found that the number of homes for sale in December grew by 4.9% compared with the same month a year earlier. In particular, the number of new home sellers entering the market this month rose annually by an astonishing 9.1%.
Although housing stock might be rising overall, if you home in on any particular city, state, or region, there’s a good deal of variation in what’s happening. We identified the real estate markets where the number of homes on the market has risen the most over the past year.
As we head into 2024, experts predict that mortgage interest rates might continue coming down, which could bring even more homes on the market, as well as buyers who can now afford them.
While this is a glimmer of good news for both homebuyers and sellers, it’s worth noting that the number of homes for sale in December still trails the much more robust levels seen in 2017 to 2019, before COVID-19. (Realtor.com listing data goes back to late 2016.) In fact, across the country, the increases in housing inventory get us only about halfway back to where levels were before 2020.
“In a historical context, the inventory level may not still be that favorable,” points out Realtor.com senior economic analyst Hannah Jones. “But it’s a lot better than it was during the pandemic.”
To find the areas with the highest number of homes on the market, we looked at Realtor.com year-over-year active listing data from December 2023 for the 150 largest metros in the country. We selected the 10 metros with the biggest year-over-year inventory increase, limiting it to the single metro per state with the largest increase, to ensure geographic diversity. (Metros include the main city and surrounding towns, suburbs, and smaller urban areas.)
Regions where housing inventory rose the most

The South saw the most substantial growth in housing: In December 2023, inventory was up 7.7% year over year in the region.
The upswing was particularly high in Florida, which led all other states with a nearly 27% increase in year-over-year active listings. Louisiana and Mississippi claimed the second and third spots, respectively.
The South has enjoyed a more dynamic market compared with other regions due to its lower-than-average prices, an abundance of new construction, and more favorable economic and lifestyle conditions attracting new residents to the area. Yet after meteoric rises in home prices and demand, many Southern markets faltered in response to the shock of high mortgage rates.
However, “the South has had an opportunity for inventory to recover,” Jones points out. “It’s improved a lot compared to last year as it continues to build up.”
This potentially sets up 2024 as a better year for buyers there.
Regions where housing inventory dropped the most

In contrast, the Northeast saw a relatively steep decline in the number of homes for sale, dropping by 8% annually in December. This is due to high buyer demand amid very limited inventory. Part of the problem is there just isn’t as much land available to construct new homes as there is in other parts of the country.
Connecticut and New Jersey lead the inventory decreases, hinting at how the pandemic gave some workers the flexibility to live farther from large cities (like Boston or New York City). This, in turn, kept demand high in the surrounding areas.
In the West, 2023 was a year of recalibration following a significant surge of inventory in late 2022. As 2023 progressed, the trend shifted. The number of homes for sale fell by 14.8% year over year in December. This decrease suggests that the market was essentially “catching up” after the previous year’s fast growth.
And with a marginal increase of 0.2%, the Midwest shows a more moderate and steady market adjustment, with inventory growing the most in Fort Wayne, IN.
The housing markets with the biggest inventory jumps
1. Cape Coral, FL
Median home list price in December: $475,415
Active listings in December: 8,449
Year-over-year inventory increase: 99.3%
2. Eugene, OR
Median home list price: $522,450
Active listings: 644
Year-over-year inventory increase: 46.7%
3. Fayetteville, NC
Median home list price: $309,706
Active listings: 960
Year-over-year inventory increase: 42.2%
4. Gulfport, MS
Median home list price: $294,950
Active listings: 1,501
Year-over-year inventory increase: 35.7%
5. Corpus Christi, TX
Median home list price: $359,000
Active listings: 2,231
Year-over-year inventory increase: 34.1%
6. Lafayette, LA
Median home list price: $270,000
Active listings: 1,143
Year-over-year inventory increase: 32.1%
7. Little Rock, AR
Median home list price: $299,900
Active listings: 1,756
Year-over-year inventory increase: 30.7%
8. Mobile, AL
Median listing price: $249,900
Active listings: 1,024
Year-over-year inventory increase: 30.3%
9. Memphis, TN
Median home list price: $317,990
Active listings: 3,428
Year-over-year inventory increase: 28.5%
10. Fort Wayne, IN
Median home list price: $299,900
Active listings: 697
Year-over-year inventory increase: 27.0%
Source- https://www.realtor.com/news/trends/home-inventory-is-finally-rising-heres-where-its-growing-the-most/